Mkomazi Estuary
- General Information and Location
- Catchment Characteristics
- Land and Estuary use
- Ecology
- Water Quality
- Hydrodynamics and Mouth Dynamics
- Physical features
- Threats
- References
General Information and Location
Derived from the word uMkhamazi, the name given relates to the sighting of a whale in the estuary at some time in the past. Stayt gives the meaning of the word to be either “the river of the cow whales” or “the great whale river”. Robertson suggests that the estuary was so named because it was here that “the Bantu saw whale cows suckling their young”. If this is true, such sightings are indicative of the sort of condition the estuary must have once have been in.
Location
By road, the Mkomazi estuary is 49 km south west of Durban. The Mkomazi estuary (30° 12’ S; 30° 48’E) lies south of the city of Durban in KwaZulu-Natal . The river is approximately 298 km long with a catchment area of 4 310 km2.
30°12’S; 30°49’E
Dimensions
1978 (Ref.1): Width:
- Maximum: 200 m
- Mouth: 45 m (at normal flow periods)
- Floodplain: 300 m to 500 m
Catchment Characteristics
Main Rivers and Tributaries
Over the period 1965 to 1967 the mean annual discharge was estimated to be in the vicinity of 30 m3/sec. Seasonal flows range from an average of 42 m3/sec.to 48m3/sec. in summer, and from 10 m3/sec to 12,5 m3/sec. in winter.
Geomorphology
Geology
The river traverses a whole succession of geological formations in its catchment ranging from old granites to Stormberg series . From recent investigations at the site of the new bridge, boring has revealed that in excess of 80m of sediments overlie bedrock in certain places. This situation is very different to that described by Orme who described Karroo dolerite as bedrock 18m below mean average sea level on the northern bank of the estuary. Dolerite also outcrops at the coast, on the southern side of the estuary mouth. It appears to form a sill (or resistant ledge) across the estuary, which retards down cutting.
Nature of bottom materials
The estuary has been described as a “sand choked” system. Black silt is found 7 m to 15 m below such deposits. Day mentions “thigh deep” mud banks on the southern bank of the estuary in the 1950’s. Near the mouth, the overlying deposits are medium to coarse-grained “washover” marine sands. They were found to be coarser if deposited on a flood tide than if deposited on an ebb tide. An aerial photograph (date 15 May 1971) clearly shows that a centrally positioned island, called Chocolate Island periodically appears +/- 1 km from the mouth. This develops as a result of deposition during years which are not associated with flooding. Severe floods (such as in 1959 or 1976) wash the island away during the course of channel migrations.
Sandbar Characteristics
The Mkomazi sandbar is normally a massive, south-directed feature. However, the mouth position can migrate from its normal southerly position during or after floods. It may close completely in the dry season but this is a rare occurrence. Van Heerden found the mean size of the spit material (as an indication of maturity) to decrease northwards. He suggests spit growth (or progradation) in a southerly direction was by over wash and beach drift. On the other hand, spit growth in a northerly direction occurred under the influence of the long shore current and southerly swells, when flood materials forming under and offshore bar were available. Breaching is normally not necessary, although ski-boat owners have been known to encourage the mouth position to switch from a northerly position (such as that on 25 July 1976) to a more southerly position by breaching. They do this in order to create a more conventional point of exit for their boats.
Land and Estuary uses
The lagoon is surrounded by flats, a business centre, sporting facilities and a civic centre.
There is an annual influx of tourists.
The lagoon is used for paddle boating and the sandbar is a popular bathing beach.
Ecology
Phytoplankton/Diatoms
No historical phytoplankton information is available for this estuary. Dense algal blooms were noted during this study.
Algae
During the survey period (2 May 1972 to 16 August 1972) 14 species of diatoms (mainly Nitzchia and Navicula) three Cynophyte species and nine species of Chlorophyta were identified as present. There was a marked increase in the algal density within the lagoon. In May 1972 this increase was 15 fold and attributed to nutrient availability below the sewage inlfow. On this occassion, 90% of the community was made up by a bloom of Phacus (at densities of 5 750 per ml). The study concluded that the persistently high algal densities, the low species diversity and actual species composition, were all biological manifestations of a nutrient charged system.
Terrestrial vegetation
Due to urbanization, very little of the original vegetation surrounding the lagoon has remained undisturbed. Forest areas alongside the river and on some steep slopes above the head of the lagoon have remained partially intact.
Very little natural riparian vegetation is left along the course of the system.
The 1937 aerial photograph shows an estuary in a fairly natural state in the upper reaches and moderately impacted at the mouth by urban development, particularly on the northern bank. These photographs also show an extensive floodplain on either side of the estuary above the present freeway. Removal of riparian vegetation from the northern bank is obvious in the vicinity of the R102 and rail-bridges and what appears to be a dirt road is present. By the time of the 1978 synthesis (Begg 1978), it was noted that urban development had obliterated most of the flood plain such that “very little of the original vegetation remained” apart from a “riverine forest community alongside the head of the lagoon and a fringe of lagoon hibiscus (Hibiscus tiliaceus)”.
The above situation prevails today, although the dirt road observed in the 1937 picture is now tarred. Flooding of this road when the mouth is closed results in pressure to breach as the road is situated right on the edge of the estuary. This results in inundation of the road when the estuary backfloods during mouth closure. Extensive and unnecessary clearing of the riparian zone has taken place in many areas, notably next to the civic centre and sports club where vast cleared areas which were previously wetlands have been infilled and are kept as open lawns. Disturbance in this riparian zone has resulted in invasion by alien plants (the entire river reach is highly invaded by alien vegetation) and also to bank failure as the soil-retaining function of the roots of riparian vegetation has been lost. The loss of natural edges and binding by vegetation has led to the reinforcement of the banks with hard structures e.g. gabions, in places where poorly sited infrastructure such as roads is now under threat.
Whilst areas of Hibiscus tiliaceus and Phragmites australis have persisted, most notably between the R102 and the N2, this system is highly impacted throughout its length. Evidence of fires damaging the coastal thicket at the mouth is of concern as this vegetation type is not fire tolerant.
Fauna:
Aquatic Invertebrates
In 1946 Day recorded te presence of two species of crabs. Metapenaeus monoceros ( a swimming prawn), may Musculus (a bivalve) and Thiara (a gastropod) within the lagoon.
More recently (29 July 1971) Jackson (pers.comm.) found the molluscs Melanoides and Trachycystis in the lagoon. Surveys in the Manzimtoti river 9 km above the lagoon in 1964 revealed a community, (made up mainly of Chironomidae) which was indicative of moderate organic pollution. Similar surveys repeated in the river in 1974 revealed that conditions had improved since 1964. Macrobenthic assemblages were found to be highly impoverished, and dominated by the alien invasive gastropod Tarebia granifera. The dominance of this species in the aManzimtoti serves as a warning to managers dealing with estuarine systems.
Fish
Van der Elst (pers.comm.) has tried netting in the lagoon on one occasion. The results were predictably disappointing. Sarotherodon mossambicus have been introduced by the Municipality to assist in mosquito control (Jackson, pers. comm.)
Begg (1984a) recorded 18 fish species of which 10 were represented by less than five individuals. The dominant species were the Mozambique tilapia Oreochromis mossambicus (47%) and the estuarine roundherring Gilchristella aestuaria (36%), which were the only species recorded in all samples. Both species are indicative of extended closed conditions and low to fresh salinities.
Ramm, Cerff & Harrison (1986f) sampled the system in August 1986 when the mouth was closed and recorded six species, including three mullet which contributed 77% of the catch. Two species, viz. the flathead Mugil cephalus (51%) and the freshwater Myxus capensis (35%) dominated the mullet catch. The very high proportions of mullet in comparison with the earlier and subsequent surveys presumably indicated a previous open mouth situation which would have allowed immigration into the system.
Harrison (unpublished), during national estuary surveys in the late 1990s, recorded 17 taxa at the species level of which 11 were represented by five or fewer individuals. The dominant species, as in Begg’s (1984a) surveys, were again G.aestuaria (77%) and O.mossambicus (8%). Mullet constituted less than 1% of the catch in the 1984 report and only 9% in 2000. The former figure is possibly in keeping with the limitations of a beam trawl in sampling mullet but the latter figure is particularly low, bearing in mind the sampling technique, and suggests minimal immigration into the system. The fish community was nevertheless rated as good (Harrison et al. 2000).
Birds Although very few in number, 14 species of estuarine associated birds were found to be present in February 1972 by Sinclair (pers.comm.). However, above the lagoon, bird life alongside the river is reported to be varied.
Water Quality
Physio-chemical Characteristics
There are records of pollution of the Manzimtoti lagoon by chemicals from the Kynoch factory, in Mercury Pictorials dated 18 March and 28 October 1909. However, ever since 1964 the lagoon has received much attention, because of its poor water quality. At one stage, pollution upstream arose from a pig farm, the Bantu location, a sewage works and a zoo and in the lagoon, from laundry effluent.
At present the Borough of Amanzimtoti send water samples for sanitary analysis every 3 months.
Thermal properties: In deeper parts of the lagoon, temperature stratification is apparent.
Transparency: The mean percentage visibility from Secchi disc measurements (0,3m to 0,9m) is 71%.
Salinity
Considering the infrequency of contact with the sea, salinities in the lagoon can be surprisingly high. The maximum salinity values recorded on 3 July 1972 were 15,6% at the bottom of the lagoon. Stratification has been apparent on some occasions, whilst on other occasions (e.g. 2 May 1972) salinities were uniform throughout the system. Surface salinities may at times approach zero.
Oxygen
Oxygen levels in 1982 (Begg 1984a) varied both spatially and temporally ranging from super-saturation to 0.4 mg.li-1 in bottom waters in keeping with the polluted nature of the system and particularly the input of ammonia. This pattern still prevailed in 2007/2008 when oxygen depletion was typical of all sites. Turbidities were generally low during closed mouth conditions but increased during stronger flows in summer.
Public Health Aspects
The safety of the water for bathing, swimming and paddling is questionable in the opinion of the State Department Health (pers.comm.). This opinion is based upon knowledge of the bacteriological quality of the lagoon and the threat of bilharzia.
Bacteriology
Faecal pollution has been apparent in the lagoon since 1953. In 1964, the river 9km above the lagoon, was shown to be highly organically and faecally polluted, such that a dry season sample showed visible signs of raw sewage. This situation was confirmed in 1966 by Livingstone et al. Lower down the river, the municipal sewage works also discharged a treated (purposely over chlorinated) effluent into the river.
Thus it was not surprising to find that in 1970 signs alongside the lagoon read “Keep out – water unfit for bathing. Danger of infection”. When closed, the lagoon has no influence on the nearby sea-bathing area because the sand-bar is considered to act as a bacteriological filter and indirectly prevents pollution of the sea.
At present, faecal pollution is attributed to Bantu areas in the catchment (Stuart, pers, comm.)
Parasites:
Viable tapeworm ova (Taenia species) were found in the lagoon in November/December 1966 and provided confirmatory evidence of faecal pollution.
Bilharzia: eH
Physopsis snails have been located (on 29 Julu 1971) in the catchment as well as just above the lagoon. The presence of Schistosoma haematobium itself has also been established – Jackson (pers.comm.). Warning signs to this effect have been erected alongside the upper reached of the lagoon. At one stage it was suggested that the lagoon be artificially flooded with sea water to minimize the chances of bilharzia transmission (Shiff, Stuart – pers. comm.). Nutrient enrichment naturally aggravates the situation
Pollution
Pollution of one sort or another has been a feature of the aManzimtoti estuary for the last century. Begg (1978) referred to Mercury Pictorials describing some unspecified pollution from the Kynoch factory in 1909. From 1964 onwards the estuary received “much attention because of its poor water quality”. This was attributed to “a pig farm, the Bantu location, a sewage works and a zoo” as well as laundry effluent in the lower reaches. Closure of the sewage works in 1974 apparently heralded some improvement. Analyses of estuary water between 1966 and 1976 at different times indicated oxygen depletion and high BOD values as well as raised levels of ammonia. In May 1980 there was a major ammonia spill from an AE & CI holding dam while ammonia levels remained high from 1977 through to the end of the survey in 1982. The nutrient status as indicated by the high nitrates and phosphate concentrations (Table 3.46), along with the previously measured high ammonia levels and current bacterial levels (maximum count of 222 000 E. coli /100ml) are indicative of a system receiving sewage effluent. This high nutrient status feeds phytoplankton blooms which ultimately produce unstable dissolved oxygen conditions in the water column resulting in fish kills which are known to have occurred during the survey period.
Faecal contamination of the estuary was noted in 1953 while a dry season sample in 1964 “showed visible signs of raw sewage”. In 1966 viable tapeworm ova were found in the estuary. In 1970 a sign indicated that the water in the estuary was unfit for bathing. The possibility of bilharzia infection through the transport of cercariae into the estuary was established through research in the early 80s.
Harrison et al. (2000) described both the water quality and aesthetics as poor. This unfortunately remains the case for the 2008 assessment with poor water quality, high levels of development, and the significant modification to the morphology of the system as a result of infilling of the floodplain all contributing to the degradation of the system.
Hydrodynamics and Mouth Dynamics
The Manzimtoti sandbar is 250m long and south extending. The lagoon is rarely open to the sea, doing so only after heavy rain. On such occasions the lagoon virtually empties completely, so that only a very small expanse of water remains.
The mouth position is stable, except during times of flood. Overtopping may occur onhigh spring tides, particularly should there be a storm at sea.
Artificial breaching is undertaken by the local authority if lagoon levels become too high.
Between May 1978 and December 1982 the mouth was breached artificially “on at least 70 occasions” rendering it impossible to determine the natural pattern but the impression (Begg 1984a) was that the system was “normally closed”. The 2007/2008 survey showed that pressure to breach the mouth has not changed in the last 25 years, especially because the road that runs beneath the N2 freeway floods within days of mouth closure and acts as an index of the extent of back flooding allowed before the mouth is breached.
Physical Features
Topography
The aManzimtoti has a length of between 10 and 14 km, or 11.6 km (Perry 1989), a catchment area of 28-33 km2 or 39 km2 (Perry 1989) and a MAR of 1-2 x 10⁶ m3.
Bathymetry
Day recorded depths of 1,8 m to 3 m in the lagoon in 1946. More recent measurements indicate a maximum depth of 1,65 m and mean depths of 0,79m.
Begg (1978) referred to past dredging and a general decrease in depth “over the past few decades due to siltation”, but also to depths of 1.8 to 3 m in the lagoon in 1946, although he does not indicate whether this was under open or closed mouth conditions. Data collected over his study period (Sept 1979 – June 1981) indicated that with the “water level at its permitted maximum” the deepest point was 2.5 m in the vicinity of the freeway and the “mean depth” in the “lagoon”, presumably the area below the R102, was about 1.05 m. Following breaching the water level could drop by up to 1.5 m and much of the floor of the lagoon would be exposed. During the 2007/2008 survey it was possible to boat approximately 2.4 km upstream during closed mouth periods. Maximum recorded depths during closed mouth periods were 1.7 m in the mouth area and hence similar to those recorded by Begg (1984a).
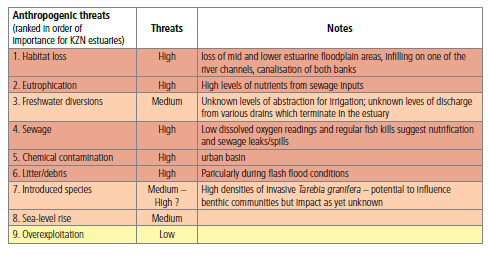
Threats
Loss of habitat as a consequence of intense urbanization; eutrophication; weir at the mouth; alien species; and chemical and organice pollution.
The 1978 assessment of the aManzimtoti estuary was that it made “no ecological contribution to Natal’s estuarine resources” and the “degraded state” was “a result of urban encroachment, sewage pollution and siltation”. No evidence was presented in the 1984 report (Begg 1984a) to refute this assessment nor apparently had the situation changed by the late 90s when Harrison et al. (2000) still rated the water quality as poor. The continued presence of the weir, regular breaching, sustained poor water quality and the appearance of the invasive snail Tarebia granifera do not bode well for the future of this system.
The above situation is of concern given the parlous state of many of the adjacent estuaries and the very real need to protect and restore whatever estuarine environments still exist. There are very real possibilities of restoring some function to this estuary if attention is given to water quality and the restoration of destroyed estuarine support habitats, particularly on the south bank.
References
The Estuaries of Natal – George Begg
Ethekwini Municipality: Durban’s Estuaries
Estuaries of Durban 2009 Report Ethekwini Municipality – Prepared by: AT Forbes and NT Demetriades